But now, I get this hard-to-understand error message.
Up through ggplot 3.4.1, this is how I made a wind rose. The basic method came from tidyverse.org, long ago.
Make some dummy data for the wind rose: create a prevailing wind from the west to make the graph look more interesting.
Make a dataframe with the windspeeds (rounded to 30 degrees) and directions in columns. I've made factors out of the speeds with 'cut'. Then make a GG bar-plot with different colors for the different wind-speed bands.
dir <-c(sample(seq(0,330,by=30),80,replace=TRUE),
sample(seq(240,300,by=30), 20, replace=TRUE))
set.seed(42) # so we don't accidentally get a number bigger than 30.
spdbin <-cut(rexp(100,rate=.3),seq(0,30,by=10), include.lowest=TRUE)
d <-data.frame(wind=dir,speed=spdbin)
library(ggplot2)
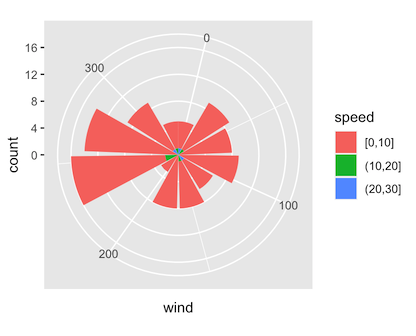
ggplot(d,aes(wind,fill=speed))+geom_bar()+coord_polar()
That graph came out like this.
(I have omitted several beautifying steps.)
But now, I get this hard-to-understand error message.
Error in `geom_bar()`:
! Problem while converting geom to grob.
ℹ Error occurred in the 1st layer.
Caused by error in `vec_run_sizes()`:
! could not find function "vec_run_sizes"